
Tensiometer Controller
The Challenge
A leading metal alloy manufacturer uses tensiometer testing to validate alloy property consistencies across production
facilities and for research purposes. The legacy system was FORTRAN-based, using a plotter. The drawbacks of this system are sensor limitations, lengthy configuration times, and cumbersome operational and management procedures. The logging, analysis and conversion from the load cell and extensiometers are tedious, manual procedures.
The Solution
Data Science Automation has developed a LabVIEW based solution to incorporate data acquisition, control, and sophisticated analysis that incorporate RS-232 and GPIB interfaces to Instron and Daytronic devices.
Abstract
The purpose of this solution is to increase efficiency by decreasing the setup time for each test, increase reliability in the results by reducing the chance for human error, and to incorporate a user interface that is easy to use.
User Interface
The LabVIEW tab control is a flexible and powerful user interface tool that permits the operator to sequentially execute the test procedures for the desired material. A load cell calibration file exists for all load cells and extensometers, and contain necessary data for configuring the device used for testing in the right manner. As seen in Figure 1 the user will select a load cell.
Figure 1 – Load Cell Select
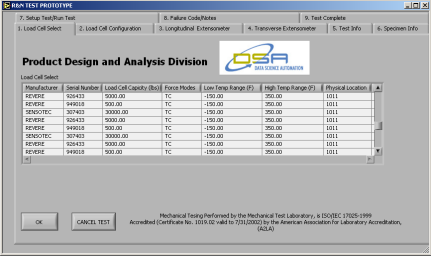
Figure 2 – Load Cell Calibration
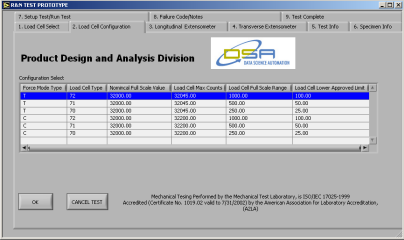
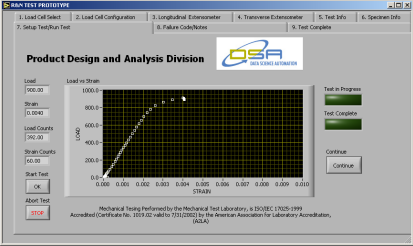
The next process, shown in Figure 2, is to use the proper configuration for the load cell selected. This process is simplified to avoid erroneous data resulting from incorrect load cell configurations. This familiar and simple process is used for longitudinal and transverse extensiometer selection, calibration and configuration, and a few other setup procedures. During test execution, data display is available as shown in Figure 3. Each test configuration/process can be stored and retrieved for subsequent use. This will greatly improved the efficiency of the testing process.
Figure 3 – Test Executed
Analysis Testing
After each test, a raw data file (illustrated in Figure 4) is generated to display the values from all devices in the system. This data file contains data such as sample #, time of sample, load cell reading (lbs), and extensometer readings from a transverse and longitudinal device. The header of this file is all of the setup information for the test.
Figure 4 – Output File

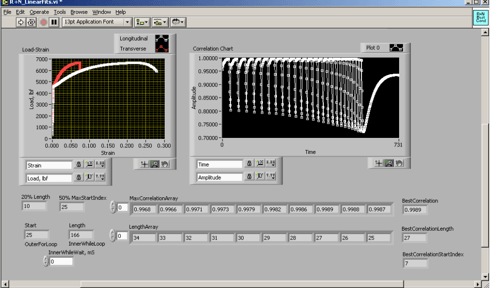
Once a data file is created the analysis can be executed. In Figure 5 an example of analysis shows the relationship between load and strain over a period of time. ASTM standards and proprietary parametric analyses were applied to derive physical properties such as Young’s Modulus, Poisson’s ratio, yield point, ultimate strength, fracture point, stress, strain, strain rate, etc..
Figure 5 – Linear Fit Analysis
Conclusion
The versatile NI-based system has the necessary flexibility to supports both Instron and less expensive third-party sensors with equal ease, reducing their dependence on one sensor vendor.
Industry:
R&D Lab AutomationAttributions:
Brandon Dineff
Engineer, Measurement & Automation
Data Science Automation
USA
And
Gregory C. Cala, Ph.D.
Vice President, Operations
Data Science Automaton
USA
And
Richard M. Brueggman
President and CEO
Data Science Automaton
USA
Products Used:
National Instruments LabVIEW 6.1National Instruments GPIB interface
RS232 Serial interface
Daytronics
Instron Series 9 Controller
Transverse Extensiometers
Longitudinal Extensiometers
Self-Qualification Form
As a technical user, you may know exactly what you need from us already. If you do, save time and streamline the discovery process with our self-qualification form, where you can let DSA know exactly what you need.
