
Drive Belt Test Dynamometer Retrofit
The Challenge
Retrofit a drive belt test dynamometer to improve reliability and improve data quality over month long tests.
The Solution
By leveraging an NI CompactRIO , TDMS, and the LabVIEW Development Environment we were able to create a reliable control system and data-logger.
Body
Part I: Introduction
Data Science Automation (DSA) is a premier National Instruments (NI) Alliance Partner that specializes in automating and educating the world leading companies. Clients choose DSA because of DSA’s deep knowledge of National Instruments products, disciplined process of developing adaptive project solutions, staff of skilled Certified LabVIEW Architects and Certified Professional Instructors, and unique focus on empowerment through education and co-development.
Our customer, a drive belt manufacturer, does performance testing on sample production drive belts. They do these tests to ensure product meets desired specifications and to ensure quality. To test the belts, they are placed on a custom dynamometer test platform. The dynamometer will drive the belts at set RPM, torque, and tension for a set time period. These tests can range from a few hours to weeks in length. The end condition for the test is end of time. A legacy NI FieldPoint based system was used control the dynamometers as well as record data on the belts. A desktop PC running a LabVIEW application would provide control logic for the dynamometer while logging and displaying data to the operator. The desktop PC would save logged data files to a network drive at the end of a test.
Due to a poor architecture design the legacy system was unable to adequately control the dynamometer while meeting their data logging needs. Tests would stop early, not stop when a belt failed, or network failures would cause logged data to be lost. These system failures resulted in belt production tests being run multiple times delaying product delivery and throwing product quality into doubt.
In addition to the dissatisfaction with the reliability of their current system, the customer wanted to add new features to their test setup to expand their belt testing ability. These new features included controlling various RPM and torque set points for the dynamometer, logging data a different rates, and monitoring belt failure conditions for early test shutdown.
Part II: Application Overview
Our goal in this project was to improve reliability and speed, using the known benefits of the Compact RIO platform. In our retrofit of the system, we moved the dynamometer control logic and data logging to a Compact RIO 9066, while a touch panel PC with a custom LabVIEW application was used for test configuration and live data display.
Operator Interface
Figure 1: Operator Interface
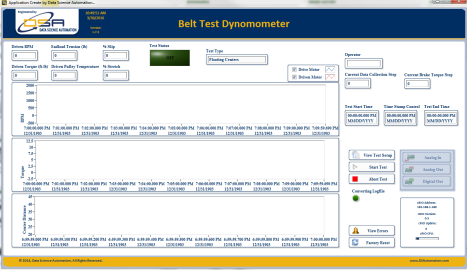
The application on the touch panel PC, shown above in Figure 1, serves as the operator interface both while the test is running. A screen that would allow an operator to configure a test, or view the currently running test, could be launched from this display. The operator interface for Test Setup is shown below in Figure 2.
Figure 2: Test Setup Screen
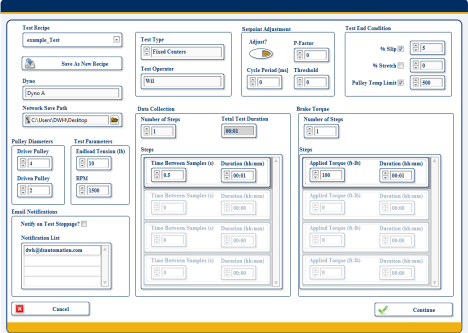
When configuring a test, the operator would specify how the dynamometer is setup for the given belt (pulley size, belt tension, and desired test RPM) and the type of test to be run. Two types of tests can be run: a fixed centers test where the length of the belt is held fixed and a floating centers test where the belt is allowed to stretch over time as the pulleys are held apart by constant tension.
The operator could then specify the period of time over which the data is collected and at what rate data is logged. This feature allowed for higher data logging rates during key portions of the test sequence, such as when the test first starts or torque applied to the belt is increased. The operator also had the ability to specify multiple torque set points for the belt as well as belt failure end conditions for the test. These conditions would end the test early if met.
The final set of parameters is for a custom proportional control algorithm that would adjust the set point for the dynamometer to meet the desired output. The motor drives in the dynamometer would occasionally drift their set point over time within a threshold and this custom control algorithm would monitor and correct for that when enabled allowing the set point to be controlled more tightly.
Data Acquisition and Logging
One of the new features of the software was the ability to log data at different rates over extended test runs. To accomplish this, data was logged into a buffer on the cRIO at the maximum data acquisition rate (60 Hz). Every 5 seconds this buffer would be flushed to the log file (TDMS). In cases where data logging was occurring at a rate lower than once every 5 seconds, the buffer was simply emptied. This buffering was implemented as performance degradation was witnessed when trying to stream data to disk at 60 Hz for extended periods of time.
Two additional aspects of the data acquisition component were displaying live data and transferring data to a network location at the end of the test. While the data acquisition and logging occurred on the cRIO, the live display of data occurred on the touch panel PC.
VI Server was used to transfer live data from the cRIO to the PC. While the data collection ran at different speeds over the duration of a test run, live data was updated approximately once a second. This data was displayed on the user interface shown in Figure 1.
The PC also handled transferring the data logged on the cRIO to the network drive. To make this process simple, an SD card mounted to the cRIO was mapped as a network drive on the touch panel PC. This drive mapping was accomplished using the WebDav feature of the Linux-based cRIO. At the end of a test the PC attempt to copy any data files on the cRIO to the network drive. If the transfer succeeded the files would be removed from the cRIO. If the transfer failed, the files would be left on the cRIO for future file transfer attempts.
Part III: Benefits of Your Application
The retrofitted belt test dynamometer allowed our client to more reliably test their drive belts. The new features added to the system allowed new drive belt products to be brought to market faster as more data could be acquire on a belt in a given test.
Part IV: Conclusion
The combination of cRIO controller for running the dynamometer and collecting data with the touch Panel PC LabVIEW application for an operator interface met the client’s needs perfectly. They are now able to test their drive belts reliably and meet their customer’s expectations.
The retrofit and upgrade has been applied to three of the client’s dynamometer test stations. The client is hoping to upgrade the remainder of their dynamometer systems to use this control system.
Contact Information
Wil Hamilton, info@DSAutomation.com
Data Science Automation Inc., 375 Valley Brook Road, Suite 106, McMurray, PA 15317
Industry:
Industrial Machinery Control Advanced ResearchAttributions:
David Wilson Hamilton, Senior Automation Systems Engineer, Data Science Automation, Inc.
Products Used:
cRIO-9066
Self-Qualification Form
As a technical user, you may know exactly what you need from us already. If you do, save time and streamline the discovery process with our self-qualification form, where you can let DSA know exactly what you need.
