
Military Vehicle Lifting and Tiedown Performance Validation Automated with the LabVIEW State Diagram Toolkit
The Challenge
All military equipment that requires transport via land, sea, rail, or air must comply with the guidelines documented in MIL-STD-209J “Interface Standard for Lifting and Tiedown Provisions” (see Figure 1). To ensure the safe transport of military assets around the globe, certification of compliance with MIL-STD 209J requires extensive testing and meticulous record keeping. Data Science Automation was selected to automate the process.
.png?width=277&height=270&name=unnamed%20(45).png)
Figure 1. 1-G Lift Test
The Solution
An automated solution was developed that built on the functionality present in the NI hardware and software. The new application transformed the relationship between the operator and the application. The previous methodology relied heavily on user input and interaction to complete the test. The new application eliminated all of the user interaction and allowed the user to concentrate on the test being conducted. The LabVIEW State Diagram (SD) Toolkit was utilized to accomplish the transformation.
Previous Method
The previously used approach utilized the capabilities of a NI PXI-1011 combo-chassis running two of the shipping examples provided for the NI-SCXI-1520 strain gauge interfaces. These examples nulled the strain gauges and acquired the data. While effective in acquiring the data, there remained a great deal of manual effort associated with setup, post processing, calibration tracking, and maintenance of a paper trail to support the test findings. The following list summarizes the required user actions prior to our automated approach.
- Manually track sensor calibration due dates and status
- Maintain a file of calibration certificates for all available sensors
- Track which sensors are being calibrated, and which are available for use
- Update and record a spreadsheet that determines test conditions applied to each fixture • Assign sensors to fixtures based on range and date of last calibration
- Manually track sensor ID, location, and I/O connections to format final report
- Manually enter scaling information for each sensor
- Manually enter tare values for each channel
- Manually record scaling and tare values for reporting
- Manually navigate and specify raw data file name
- Ensure data was saved immediately after the test was completed to prevent data loss • Record time values shown on chart to locate valid test period in raw data file
- Use spreadsheet software to reduce data set and ensure min, max and average are in range
Figure 2. Main Screen and State Diagram
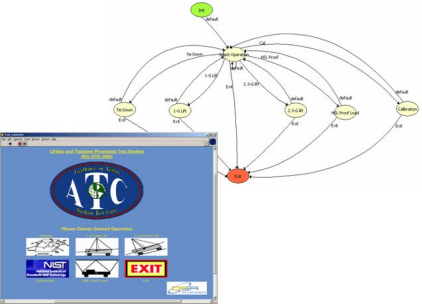
New Method
Figure 2 shows the main screen of the application along with its state diagram (SD). As illustrated, the application was structured such that the user can select from one of four types of tests or the calibration screen. By utilizing the State Diagram Toolkit, the coding of the main application was developed and debugged in less time than it took to create the custom graphics used on the main screen. Our design approach leveraged the fact that all of the tests types were of the same form, and could be realized by first developing the worst case test. The worst case was then cloned and adapted to handle the remaining tests (details of the tests follow later). Only the “Calibration” support task required a unique approach.
Figure 3. Calibration SD (Background), Calibration Main (Lower Left), and Sensor Detail Screen (Upper Right)
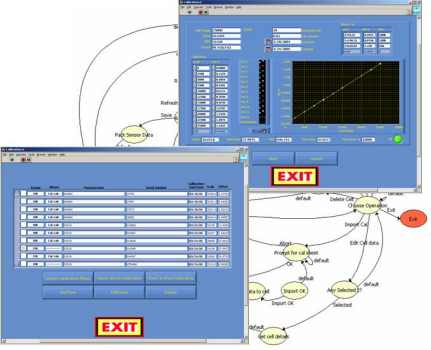
Calibration Support
Figure 3 illustrates two of the screens presented by the Calibration Support function. The functionality exposed by these screens and implemented using the SD Toolkit addressed all of the housekeeping tasks associated with managing the available sensors (strain gages). The Calibration Main screen shows a summarized list of the entire sensor set. If a sensor is due to be, or is currently, being calibrated, the entry for that sensor reflects such. The Calibration Main screen will allow a user to “check in/out” sensors to the calibration lab, add new sensors to the inventory, delete old sensors as required, edit/review the details for a selected sensor and import new calibration sheets. When a user adds a new sensor, imports a new calibration sheet or edits a sensor, the Sensor Detail screen will be displayed. The Sensor Detail screen will display all of the known information for a sensor and will evaluate the linearity of the sensor and alert the user if the calibration information is questionable. All changes initiated by the user using the Calibration Support functions are always saved to file to support the rest of the application. All imported calibration sheets are automatically archived to support an audit trail.
Figure 4. Test Screens

A) Identify Test Item Characteristics, B) Select Test Options, C) Define Rigging Requirements,
D) Identify I/O Connections, E) Verify Hardware Functionality, and F) Run the Test
Testing
The montage shown in Figure 4 illustrates how the application, with the high-level support of the SD Toolkit, automated the support tasks (see Challenge section). When a test is selected the user is asked to identify the item (Figure 4-A) to be tested and specify the location of the tiedown provisions relative to the center of gravity. A reference image is included to assist in completing the required fields. The entered information is used to update and save a spreadsheet file documenting the test conditions applied to each fixture. The resulting file is named based on the item ID and time, to an item specific folder. Tests that have multiple execution modes will allow the user to choose the desired mode (Figure 4-B).
The spreadsheet and the sensor data (see Calibration Support) are used to determine the optimal sensor set and their associated rigging requirements (Figure 4-C). The SD Toolkit was extremely helpful during the design of the sensor set optimization functionality. The complexities of the optimization task were eliminated as the module was being developed. The SD Toolkit allowed the developer to concentrate on the algorithm while providing a high level representation for the current implementation. The final rigging requirements are then used to annotate a reference diagram and document the optimal sensor assignments.
As the item is being rigged for test, the user is required to identify what hardware I/O point was used for each sensor by selecting from a drop-down list of I/O points (Figure 4-D). The drop-down list eliminated typographic errors and permitted an arbitrary set of I/O points. The arbitrary selection facilitated testing when some of the SCXI-1520’s are in calibration or if single point hardware failures are encountered. The application tracks the sensor ID, location, and I/O connections for inclusion in the final report. The I/O connections are also used to assign the scaling and excitation requirements to the appropriate I/O channel.
After the sensors are connected the application will null and test all of the sensors. Failing sensors are enunciated and the user is alerted to the failure (Figure 4-E). The user can then re-configure the sensor connections if hardware failures are suspected. The application will allow this process to be repeated as often as is required until all sensors are nulled and pass the shunt calibration checks. When all preliminary checks are satisfied, the application will transition to the data acquisition mode.
In data acquisition mode (Figure 4-F) the user is allowed to tare all of the channels using a single button (not shown) to compensate for the mass of the rigging. Taring can be repeated as often as required prior to starting the test. When a test has started, taring is prohibited, and the chart is updated as readings are acquired. A logging buffer is maintained that ensures the previous five minutes worth of data is always available.
The testing and data acquisition procedure, following MIL-STD-209J “Interface Standard for Lifting and Tiedown Provisions,” is used to validate that tiedowns are properly designed and mounted to avoid defects, detachments, and deformations when challenged by actual gravitational forces up to 4.3G.
When a test is stopped a graph is then populated with the contents of the logging buffer. The logging buffer allows the user to secure the test item and stop the test at their leisure. The user has the option to adjust the data set using the native LabVIEW zoom tools and can specify the test period using cursors. When the user is satisfied with the results they can save the data. When saving, the report file is written to the item specific folder discussed earlier. The scaling information and tare values for each sensor are also saved to the report file. After the file is written the report is complete and requires no editing.
Summary
The pre-existing application required constant care and feeding to operate effectively. The new application turned this relationship upside down and now serves the user. The State Diagram Toolkit facilitated a “top-down” design and development effort. The various manifestations of tests were easily cloned from a single worse-case prototype because the State Diagram Toolkit allows the manipulation of an application’s architecture while minimizing coding details. This resulted in a pronounced decrease in development time. The sensor selection algorithm which was a daunting tasks when executed manually, decomposed into a concise set of simple operations once it was subjected to review using the State Diagram Toolkit.
Industry:
Aerospace DefenseAttributions:
Benjamin A. Rayner, Jr.
Consultant, Measurement & Automation
Data Science Automation Inc.
USA
And
Gregory C. Cala, Ph.D.
Vice President, Operations
Data Science Automation
USA
And
Richard M. Brueggman
Founder, President and CEO
Data Science Automation Inc.
USA
Products Used:
LabVIEW 7 Express
LabVIEW State Diagram Toolkit
NI-PXI-1011 PXI-SCXI Combo-chassis
NI-PXI-8186 Embedded Controller
NI-PXI-6052E Multifunction I/O
NI-SCXI-1520 8-Channel Universal
Strain/Bridge Interface
Self-Qualification Form
As a technical user, you may know exactly what you need from us already. If you do, save time and streamline the discovery process with our self-qualification form, where you can let DSA know exactly what you need.
