
MEMS Digital Microphone DSP Analysis Migration
The Challenge
A company doing acoustic testing wants to standardize the data acquisition hardware used in their test systems. This move however requires migrating the functionality of hardware-based digital signal processing into an existing LabVIEW application.
The Solution
Utilizing the LabVIEW Sound & Vibration Toolkit and an M-Series data acquisition card, Data Science Automation was able to duplicate the analysis originally performed in the legacy dynamic signal acquisition card.
Abstract
A manufacturer of on-chip microphones needed to standardize their acquisition hardware across several different test systems. To accomplish this goal they needed to migrate from a legacy dynamic signal acquisition card to a more general M series data acquisition card. However this change required moving the calculations that the specialized hardware performed into the existing LabVIEW application. The Sound & Vibration toolkit allowed the developer to accomplish this task with aplomb.
Details
No consumer witnessing the shrinking of televisions, cell-phones, or televisions into cell-phones would doubt for a moment that components are daily becoming smaller, faster, more efficient, and offering greater precision. However, the same is also true for the companies making the cutting-edge components that turn yesterday’s scifi fantasy, into today’s products.
A key technology in this revolution is MEMS (Micro-Electro-Mechanical Systems). Simply put, MEMS is the technique of using conventional semiconductor production processes to etch into silicon microscopic mechanical structures that can serve as actuators or sensors. To maintain their place in this rapidly-changing market, the manufacturer of MEMS-based, on-chip microphones needed to reduce costs and make their test management more efficient.
The path they choose was to consolidate their use of National Instruments products to improve the maintainability of their test processes. The goal of this drive towards improved efficiency was to merge the different LabVIEW-based applications they currently used into a single program that would be used through-out their organization.
Complicating the task was the fact that the various groups doing product had widely divergent requirements. For example, the Reliability group, which tested and tracked how repeatable their product tests were, need to test fundamentally different things than the Test department, which performed the production testing of their products prior to shipment. Due to these differences, the two departments independently developed test tools that met their specific needs.
However as Data Science Automation (DSA) considered this challenge they came to realize that the real problem was not the software – after all the two applications shared many of the same requirements for signal generation and acquisition, acoustical analysis, and displaying and storing the data. A good modular architecture (DSA’s forte) would solve the software issues. The real challenge was due to hardware differences.
The reliability department’s application implemented its signal processing in hardware on an aging NI-DSA card from National Instruments. By contrast, the test department’s application incorporated an M-series data acquisition card and performed all of its analysis in software. Although the NI-DSA card contained a digital signal processor that is not available in M-series DAQ cards, the Dynamic Signal Analyzer card was a legacy device and thus not a suitable replacement for the M-series card. Therefore, DSA made the decision to migrate the processing that occurred in the NI-DSA card into the merged software application (Figure 1).
.png?width=431&height=318&name=unnamed%20(46).png)
Figure 1 – State machine diagram depicting the merge of Swept Sine functionality into existing application framework.
The processing that the reliability department had previously been done in hardware was a Swept Sine analysis. As its name implies, this common audio analysis technique involves driving the device under test with a single tone sine wave that is swept across a range of frequencies while measuring the device’s response. In this case, the frequency generator output feeds an amplified speaker while the microphone under test acquires the response. An analysis is then done to compare how well the microphone measures or reads the generated signal. Beyond this baseline measurement, they also conduct total harmonic distortion and noise measurements.
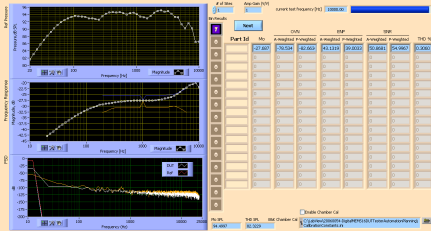
On the other hand, while the existing test department software performed frequency response analysis, it did so using a different technique that utilized multi-tone signal generation instead of a sweep of many different frequencies. The multi-tone method provides results for a handful of particular frequencies, whereas the Swept Sine method allows for more frequencies to test and also removes alias frequencies that are possible with multi-tones. Another tradeoff between the two techniques is that the multi-tone measurement is quicker but the analysis it provides is not as detailed as you get from a Swept Sine. The resolution was to standardize on the Swept Sine analysis process as implemented in NI’s Sound & Vibration Toolkit. Figure 2 shows the different analyses conducted using the Swept Sine analysis as they appear on the user interface of the new test department application.
Figure 2 – User interface displaying Swept Sine analysis data. Graphs top down: Reference Microphone Pressure, Frequency Response, and Power Spectral Density.
However, the challenge didn’t stop there: The test department’s test systems used custom hardware to control the power up, clock and other signals needed to test the microphones. For example, the output of the microphone was not an analog signal. Rather, it returned its output in pulse code modulation (PCM) format that the M-series high-speed digital I/O lines read. The
ability to read this PCM data and convert it into an analog representation was already developed and proven, but the Sound & Vibration Toolkit’s Swept Sine VIs all assumed an analog input from the device under test.
Due to the timing sensitivity of the swept sine process was a potential show-stopper for this project. This added processing time had to be managed carefully without sacrificing data quality. Thanks to the documentation provided with the toolkit’s Swept Sine code, Data Science Automation was able to successfully modify the code to read digital data and still conduct the Swept Sine analysis properly.
In the End
Thanks to broad range of add-on toolkits and abilities of LabVIEW the company was able to simplify their testing needs by having a single application to handle a variety of different functions. With this approach, the maintenance costs for their test systems dropped because the in-house developers only had to manage one set of source code instead of two. Moreover, the process of making future deployments was simplified because less thought has to go into which department would be using the new system since the application satisfies needs of multiple departments within the company.
Industry:
Prototype Validation TestAttributions:
Quintin R. Stotts
Consultant, Measurement & Automation
Data Science Automation, Inc.
USA
Products Used:
LabVIEW 8.2
Sound & Vibration Toolkit
NI DAQ-mx 8.6
Self-Qualification Form
As a technical user, you may know exactly what you need from us already. If you do, save time and streamline the discovery process with our self-qualification form, where you can let DSA know exactly what you need.
