
Engine Assembly Cam Shaft Testing
The Challenge
Produce a portable data collection system to record camshaft timing data utilized in production line quality control verification testing of engine assembly. Valve displacements measured with LVDTs had to be correlated to degrees of crankshaft rotation over seven-hundred and twenty degrees.
The Solution
The solution utilized USB technology to centralize the data collection in an SCXI chassis to allow laptop computers to be used to control the data collection system. Hardware timing based on a crankshaft encoder allowed faster and more accurate data collection of camshaft timing information.
Abstract
A large automotive manufacturer desired to automate the verification testing for engine camshaft timing. Time consuming manual measurements needed to be replaced with a system that could correlate multiple valve displacement readings versus crankshaft rotation angle. A USB (SCXI-1600) controlled SCXI chassis allowed the design of a portable test system that reduced test effort and test duration. An encoder connected to the crankshaft provided the clock signal for sampling the
camshaft analog displacement transducers, while a digital output distance sensing laser was used to trigger the data collection at the critical time of piston top-dead center.
Crank Up the Speed!
This system was designed to make a typically difficult job of measuring valve timing versus crankshaft angle a much simpler affair for the technicians. Prior to utilizing this system the operators would measure each valve displacement versus crank angle using dial indicators and comparing readings of the displacement and note the readings from a separate crank angle sensor tied to the encoder.
Data Science Automation was able to completely automate the data collection portion of this test. The SCXI-1000 chassis in combination with the SCXI-1600 USB controller yielded a portable system that could be run by any portable laptop with the LabVIEW Run-time Engine.
The SCXI-1540 8-Channel LVDT module was utilized to allow the system to measure four LVDT sensors. The number was kept at four LVDTs versus eight due to cost constraint and engine valve bank layouts.
A Nikon RX2000 encoder was utilized to track the crankshaft rotation angle. The A channel signal was used to clock the LVDT data acquisition samples through the USB-1600 PFI7 line. The analog LVDT acquisition task was also configured with a digital start trigger which is supplied by the Keyence Digital CMOS Laser Sensor.
The crankshaft on the engines being tested has a keyway that points straight up when the engine is at the Top Dead Center (TDC) of piston position. The laser sensor mounting bracket was designed to allow the laser to target the forward edge of the key when the crank is in the proper position. See Figure X.

Figure 1 – Crankshaft Keyway and CMOS Laser Triggering Alignment –DAQ Task Digital Start Trigger
This configuration precludes the technicians from having to try and match a TDC reading by hand and then hitting some software button to start the test. The operator simply attaches the laser, crankshaft encoder and LVDTs to the engine and sets the crankshaft position to some point before the key would pass in front of the laser and starts the test. Well designed test fixtures guarantee that crank position will be comparable from test-to-test and engine-to-engine.
Main Program Architecture
The main program in this system utilizes the User Interface Event Handler architecture to respond to the operator control inputs. The timeout event of the Event Structure contains a Case Structure that executes the desired actions selected by the operator through the response to Enumerated States.
Figure 2 - User Interface Event Structure Timeout Case

The operator’s main system control is handled through a cluster of buttons. Buttons Enabled states are changed depending on the current state of the system to preclude the operator from commanding an illogical sequence of events in the code. See Figure 3

Figure 3 – Main Operator System Control Buttons
In addition to the main Event Handler top level VI this system is broken down into three major modules: • Test State Machine
- Data Analysis State Machine
- Data File Writer State Machine
The Test Controller State Machine is launched dynamically and does not block the operation of the main GUI VI Event Structure. The other two state machine run in the Event Structure cases dedicated to the buttons that launch them, i.e. Analyze and Save Results.
Graphical Interface
The main operator Graphical User Interface (GUI) consists of system colored controls. The main interface is broken up with a tab control that has three pages. The first page is for set up of the hardware utilized in the system as well as the acquisition timing information which is based on the encoder selected for the crankshaft position tracking. Allowing the operator to utilize differing encoders and exposing the number of pulses per revolution setting makes this system reconfigurable for finer position measurements if higher resolution encoders are utilized in the future. Settings are also available for the LVDTs utilized to take the valve displacement measurements. Operator control buttons allow the test technician to control the operation of the software testing stages.
Figure 4 – Main GUI System Control Buttons and Tab Control Set Up Page
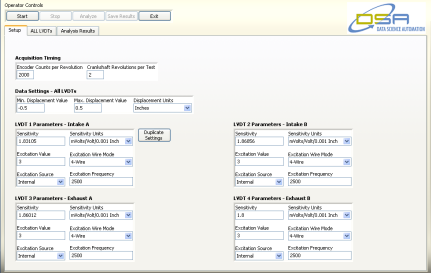
The second page of the Tab Control contains a Sub Panel. After the operator presses the <Start> button the main program
Event Structure performs a dynamic launch of the Test Controller State Machine code. The front panel of the Test Controller contains a graph that shows the raw LVDT displacement data versus raw crank angle in absolute degrees of rotation. Utilizing a plug-in structure like this allows this code to more easily upgraded in the future if more functionality in the test procedure is desired. See Figure 5 for the ALL LVDTs page Sub Panel showing the Test Controller front panel loaded.
Figure 5 – Test Controller State Machine Front Panel Shown Loaded in the Sub Panel of the GUI
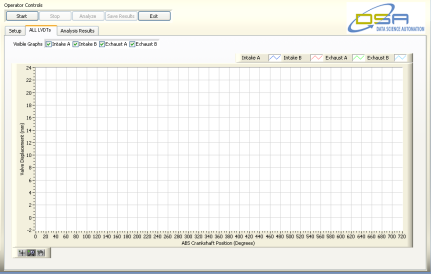
As can be seen in Figure 5 above the operator has the option to make visible or invisible any combination of the four LVDT graphs. LVDTs are configured on the engine in the arrangement of Intake A, Intake B, Exhaust A and Exhaust B.
Test State Machine
As previously stated this State Machine module is launched dynamically by the main GUI Event Structure VI. This module configures the DAQmx LVDT analog input task with the pertinent timing information and LVDT settings.
The task is configured to start when the input signal from the CMOS Laser Sensor goes high, indicating that the piston is at TDC. This module continues running until all data points are collected or the operator presses the Stop button. The front panel that is inserted in the main GUI sub panel is updated live with valve displacement versus crankshaft angle as the operator is rotating the crankshaft.
Once all of the data points are collected the task stops the Operator Control button enabled states are changed to allow the system operator to progress to analyzing the data or discard the data and start collection of another data set.
Analysis State Machine
After the operator has been satisfied that the data collected is acceptable they press the Analyze button. This fires the corresponding Even Structure Case and runs the Analysis State Machine module. This code is set up to be blocking and runs in the Case Structure in the Event Structure Timeout case since it happens very quickly.
The primary function of the Analysis State machine is to extract pertinent data specified by the customer. The collected valve displacement data for each LVDT is analyzed for the following four discreet points:
- Crank Angle when the valve is 1mm open (valve is progressing from being closed to fully open) • Maximum Valve Opening (Displacement )
- Crankshaft Angle at Maximum Valve Opening
- Crank Angle when the valve is 1mm from being closed (valve is closing from being fully opened)
The basic algorithm splits the data in two pieces – data leading up to the full valve displacement and data from full valve displacement to valve fully closed. The data tracing the valve displacement as the valve is closing is reversed and then searched for the point at which it is 1mm from being closed. This shortens the analysis and allows the same search mechanism as for detecting the position of the crank at 1mm open from fully closed. This is simply done with the Threshold 1D Array function. The implementation of this algorithm can be seen below in Figure 6. This analysis routine is a reentrant Vi allowing all four channels of data to be analyzed simultaneously.

Figure 6 – Main Data Analysis Algorithm
Once the analysis is complete the program automatically switches the GUI screen tab control to the Analysis results page. This allows the test operator to review the results of the test. See Figure 7 below.

Figure 7 – Main GUI Analysis Results Tab
In addition to switching the tab control to the Analysis Results page the code also changed the state of the Operator Controls buttons to allow the operator to press the <Save> button if the data is to be recorded to file.
File Data State Machine
After reviewing the data the operator is able to save the data if so desired. Pressing the <Save> button launches the final State Machine in this software. The raw data and analysis results are all converted into string format in this state machine and saved to a Comma Separated Variable file. See Figure 8 below.

Figure 8 – File Save State Machine – Writing Data to CSV File.
The utilization of a data file module again allows for future maintainability and scalability of the overall system code. The choice of using a CSV based text file means that a wide variety of systems are able to view the data.
Summary
The combination of using National Instrument LabVIEW and National Instruments hardware and third party vendor
hardware has resulted in a complete camshaft timing verification testing system that as reduced individual engine testing time by up to thirty minutes for each engine. Prior to utilizing this solution the customer technicians performed camshaft timing tests on individual valves and had to analyze the data in a separate program before even knowing if the test was performed properly.
Industry:
Attributions:
Ryan W. Vallieu
Consultant, Measurement & Automation
Data Science Automation, Inc.
USA
Products Used:
LabVIEW 8.5
SCXI-1000 4-Slot Chassis, U.S. 120 VAC
SCXI-1374 Handle Kit for SCXI-1000
SCXI-1361 Rear Filler Panel
SCXI-1600, USB Data Acquisition and Control Module
SCXI-1540 8-channel LVDT Module
SCXI-1100 32-Channel Multiplexer Amplifier, Signal conditioning module for TC, volt, millivolt, and current input
SCXI-1303 32-channel isothermal terminal block - for SCXI-1100
Phoenix Contact PLC-OSC-24DC/24DC/2 Relay 24VDC, 20μs response time
SMB-110, SMB to BNC Male Coax Cable, 50 Ohm, 1m
Nikon RX2000-22-1A Rotary Encoder
Keyence GV-45H Digital CMOS Laser Sensor
Keyence GV-21P PNP CMOS Laser Sensor Amplifier
MDR-40-24 Mean Well 40W, 24V Single Output Industrial DIN Rail Power Supply
DR-30-5 B&B Electronics 30W, 5VPower Supply
Self-Qualification Form
As a technical user, you may know exactly what you need from us already. If you do, save time and streamline the discovery process with our self-qualification form, where you can let DSA know exactly what you need.
